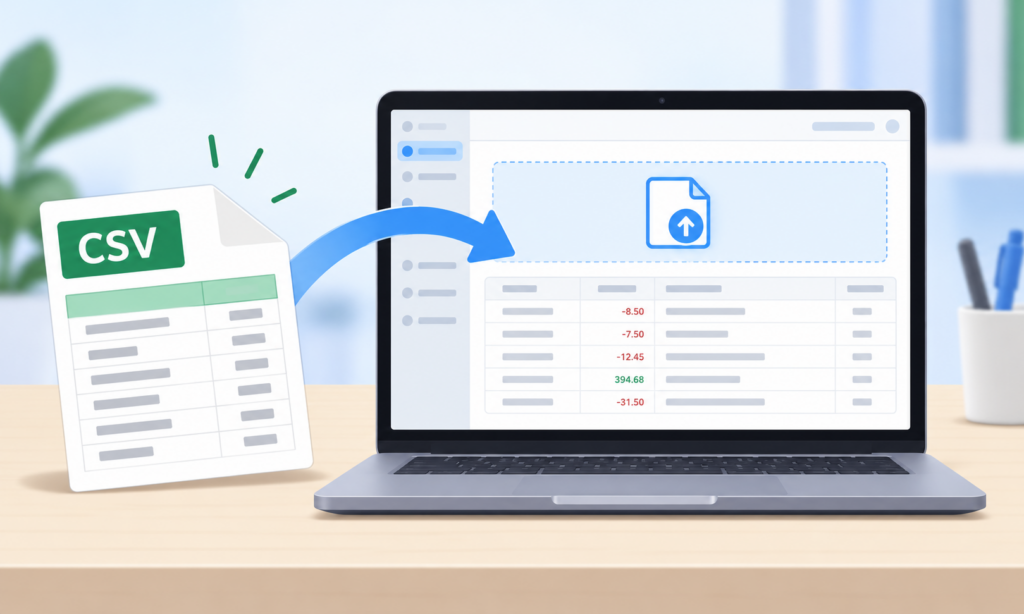
For a while now, Seller Ledger has offered ways to upload all kinds of data using CSV files.
For example, Seller Ledger lets you bring in CSV data for the following:
Mileage
Bank and credit card accounts with poor direct connectivity
Bulk income and expense transactions
Manual asset account transactions and orders/refunds (which can be used to import sales data from not-yet-supported marketplaces)
Single inventory purchase with multiple line items
Bulk inventory with multiple items across multiple purchases
To make life even easier, we’ve just rolled out some major improvements to this functionality.
More flexible layouts
Until now, we’ve required that customers format their files to fit our templates. However, that’s now changed. You can upload the file in the format you (or the bank, or a third-party marketplace) already have. Seller Ledger will try to parse it as-is. You can now have slightly different column names and they can be in a different order. In fact, with bank and credit card files, different banks use signs differently – Seller Ledger can now figure out what they mean.
Preview your data before uploading
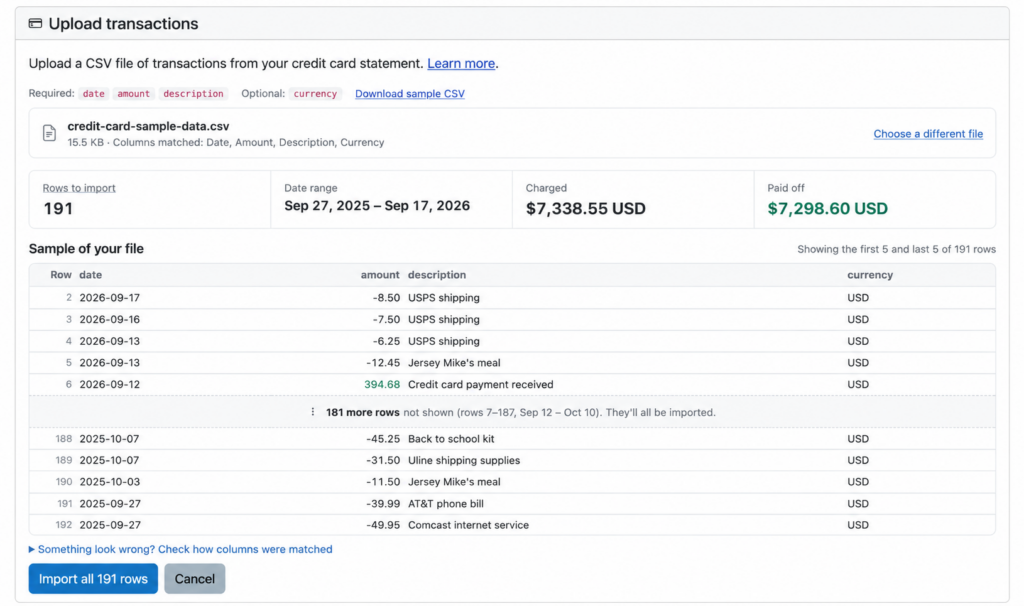
To date, when uploading a CSV file, you would wait for us to process it and either receive a less-than-helpful error message, or the data would be imported. Now, when you upload your file, Seller Ledger will give you a preview of the data before it gets added to your books. If you see something that looks off, simply cancel, change your file, and try again.
Ready to automate your eCommerce bookkeeping?
Join thousands of sellers who save hours every month with Seller Ledger.
In our continued efforts to make it easier for customers to track their inventory costs, we now offer the ability to assign costs to multiple items after they sell.
How do I assign costs to multiple items?
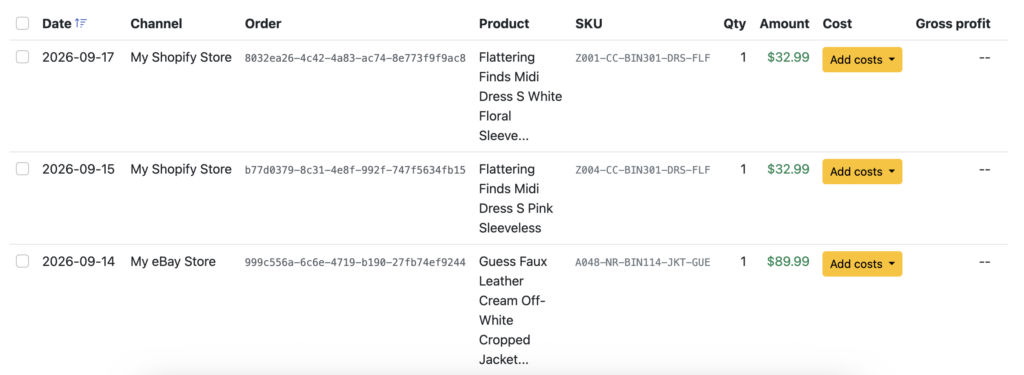
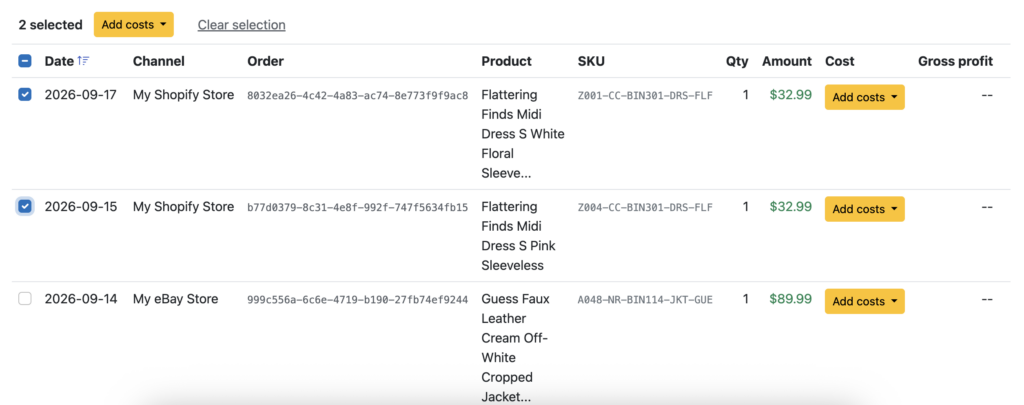
For both periodic and continuous inventory trackers, simply go to the Inventory -> Sold view, which has been redesigned. This screen allows you to add costs to items after they have sold, which we have offered for a while. But now, there’s an additional option.
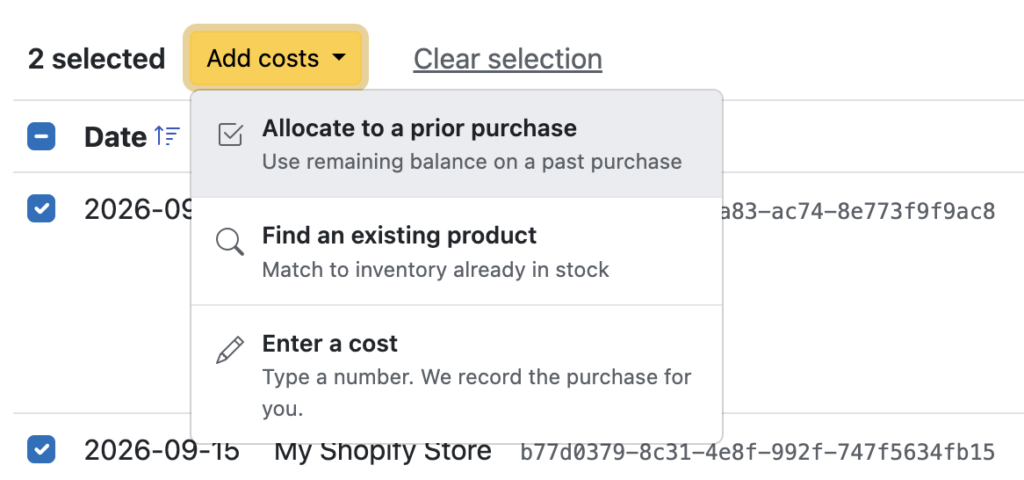
To add costs to multiple items, check the boxes in the left column and click the “Add costs” button at the top:
Clicking that button brings up a list of options for how you’d like to handle those costs:
For sellers with large transaction volumes, this should speed up the process of updating your cost of goods..
Ready to automate your eCommerce bookkeeping?
Join thousands of sellers who save hours every month with Seller Ledger.
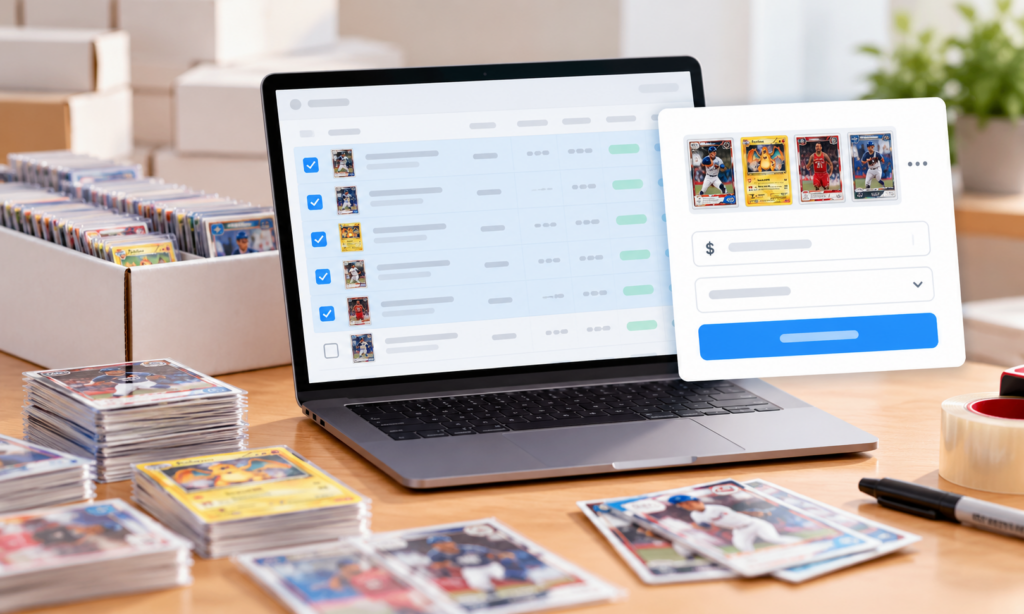
Are you a card trader or someone who buys larger lots of items and breaks them into smaller groupings to sell? If so, we’re excited to announce some new capabilities to Seller Ledger’s inventory tracking. You can now break a larger inventory purchase into smaller items.
Thanks to all of our sellers on platforms like eBay, Whatnot, TCGplayer, Mana Pool and others for their suggestions.
To start, this feature is only available if you are using continuous inventory tracking in Seller Ledger. That’s because you’ll need to track the cost of the original item purchase before you can break it into smaller batches or individual items.
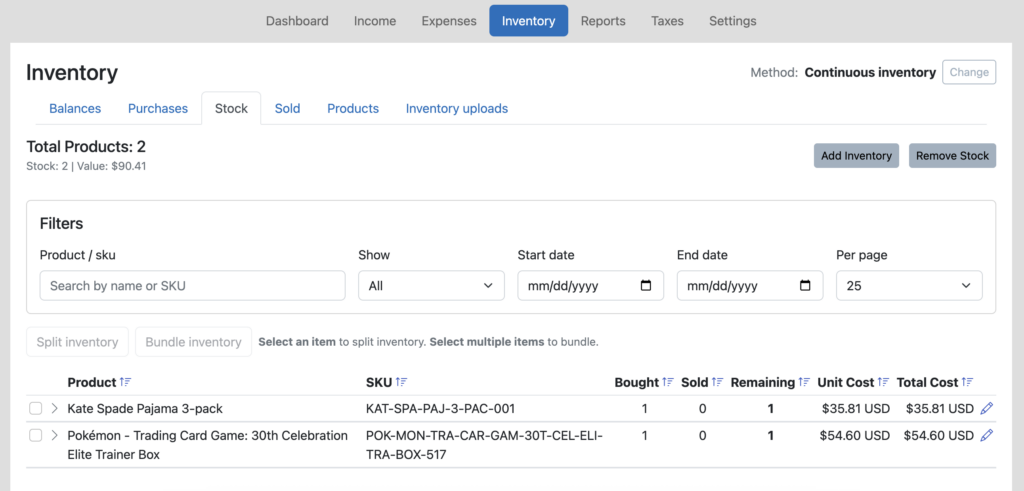
Once you’ve recorded your item purchase and loaded the costs for that item, simply go to the Inventory -> Stock page and find that item.
Then, select the item by checking the box in the left column. You will see the “Split Inventory” button change to active. Click that button.
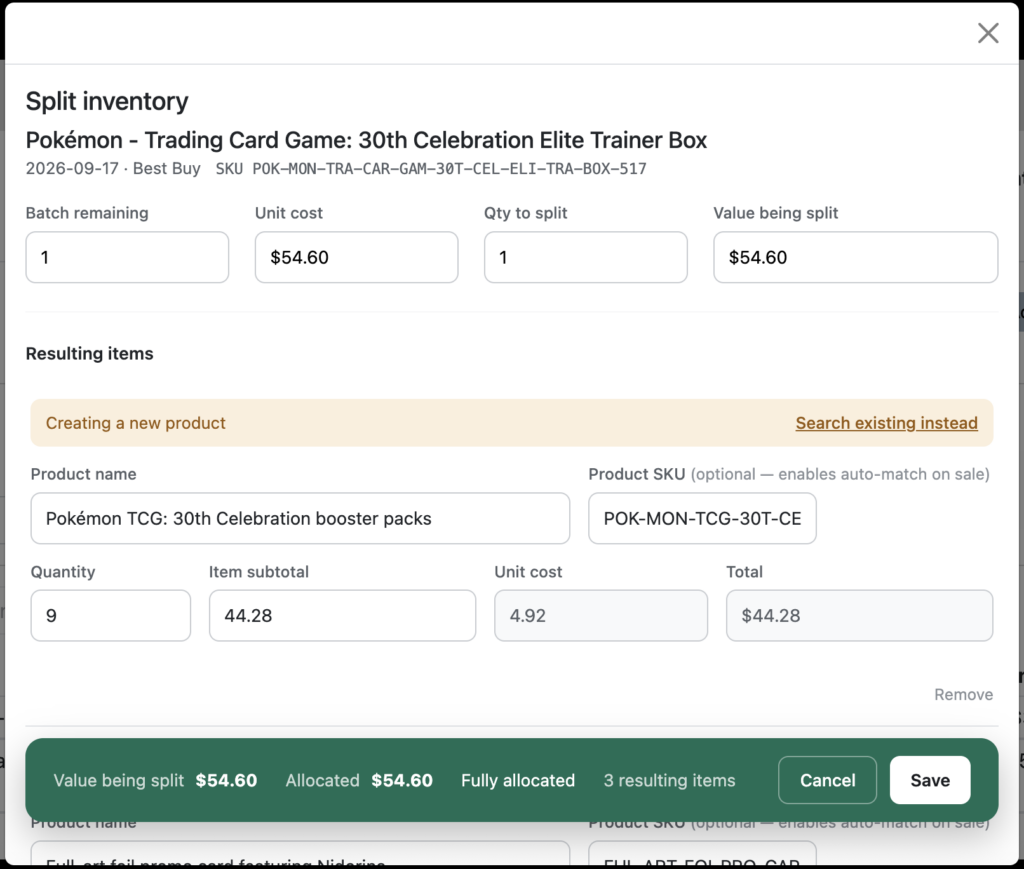
This will bring up a form that looks just like the form to add costs to an individual purchase. But now, you get to record the individual items that you are breaking the larger item into.
Make sure that the costs of all of the individual items sum up to the original item cost and click Save.
Cost allocation
When choosing the cost of each individual item, you’ll want to research IRS rules on cost allocation, often using fair market value or proportional allocation. Arbitrary cost allocation is discouraged.
You’ll now see, in your Inventory -> Stock view, that the original item is grayed out, but 3 new items have been added to your inventory, with the proper cost allocations.
Tying costs to their sales
If you use unique SKUs for each of the individual items you just created, and include them when you list your items for sale, Seller Ledger will automatically match the sale to these new, individual items using the SKU value, and use the cost of each of those items to update your cost of goods sold and reduce your inventory.
If you forgot to include the SKUs in your listings or otherwise need to match the sold items after-the-fact from Inventory -> Sold, you’ll see these individual items listed when trying match, not the original bigger box.
As with all new features, we welcome any feedback you have.
Ready to automate your eCommerce bookkeeping?
Join thousands of sellers who save hours every month with Seller Ledger.
Let’s face it – inventory tracking is the hardest, most laborious part of eCommerce accounting and bookkeeping. Many small sellers choose to skip it altogether, using the cash-based method of writing off every inventory item as cost of goods sold as soon as they make the purchases. Others try tracking the cost of every item purchased all the way through to sale. And yet, most of those sellers still have trouble keeping up with the tracking required to do so.
Well, now there’s a more flexible inventory tracking option: periodic inventory.
What is Periodic Inventory tracking?
Periodic inventory tracking is the most flexible inventory tracking option available to merchants because, instead of tracking every single inventory transaction, you can simply take “periodic” counts of your unsold inventory, update your inventory balance, and calculate cost of goods sold based on a simple formula that matches IRS tax forms:
Cost of Goods Sold = Beginning balance + Purchases - Ending balance
For a deep dive into period inventory tracking, feel free to check out our support article.
A simple example
Let’s say, on your last year’s tax return, you filed an ending inventory balance of $5,000. Let’s also say that, for this entire current tax year, you buy another $10,000 in inventory. Rather than trying to track every item coming in an out, you simply wait until the end of the year and count up all of your unsold inventory. And let’s say you discover that all of your unsold inventory cost $2,500. That means that the cost of all of the items you sold this year was $12,500
It makes sense, right? If you have less inventory at the end of the year than you did at the beginning of the year, you must have sold more than you purchased.
Counting up your inventory once per year is a lot less work that trying to track the ins and outs of every item purchase and sale. But it also gives you much better insight into your business performance than just writing off all of your purchases using the cash-based method.
Let’s take the example above. Let’s say you sold $25,000 worth of goods for the year. Under the cash-based inventory method, you would have claimed $10,000 in cost of goods sold. Using that number to calculate your gross profit and margin for the year, you would think you made $15,000 in gross profit, or 60% ($15k profit divided by $25k in sales).
But the periodic method shows your cost of goods sold as $12,500. In that scenario, you would know that you actually made a gross profit of $12,500, or 50% ($12.5k profit divided by $25k in sales).
And using the cash-based inventory method also means that there will be other years where you were less profitable than you realized.
For the cost of counting up your inventory at least one time per year, you get a much more accurate view into your business.
Cash vs Periodic: They are closer than you think
If you want to see just how close cash and period inventory are, just check out this blog post. Hint – the only difference is whether you track an inventory balance at all.
How it works in Seller Ledger
If you are interested in trying periodic inventory tracking in Seller Ledger, it’s quite simple to turn on. Click on the Inventory tab and, in the upper right, click the “Change” button next to your current inventory tracking method.
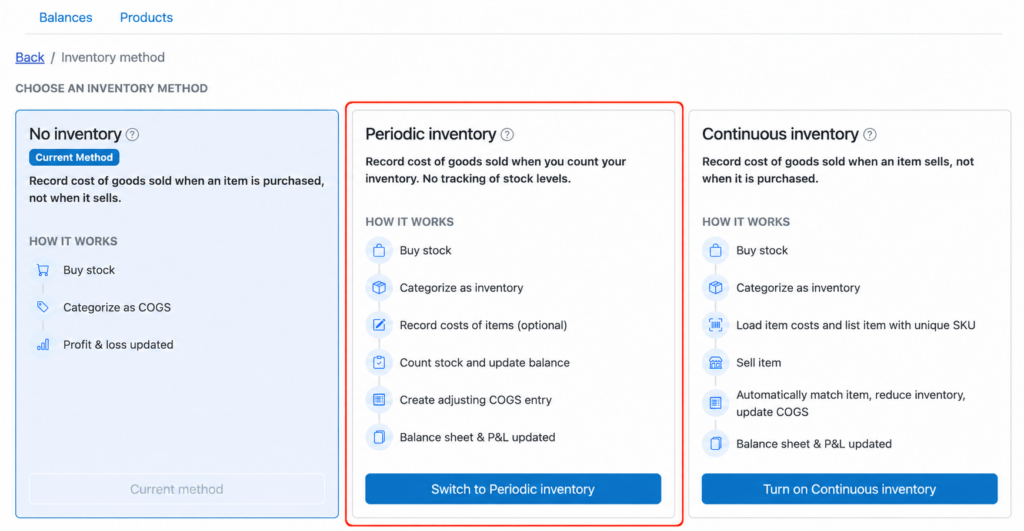
This brings up a screen where you can now explicitly choose periodic as an option.
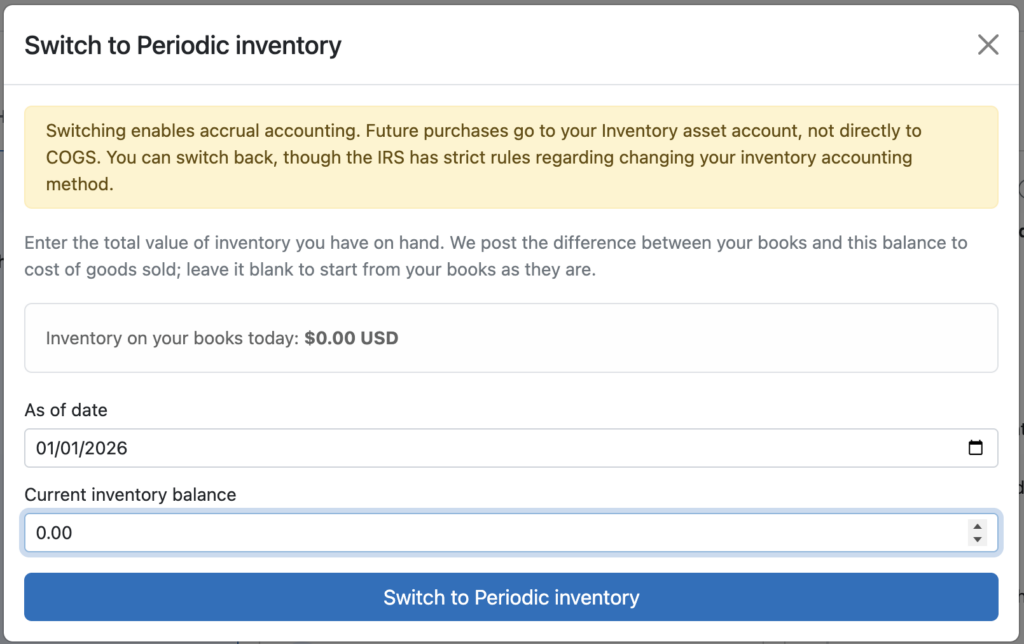
Click the button to switch to periodic and then enter the starting date and balance.
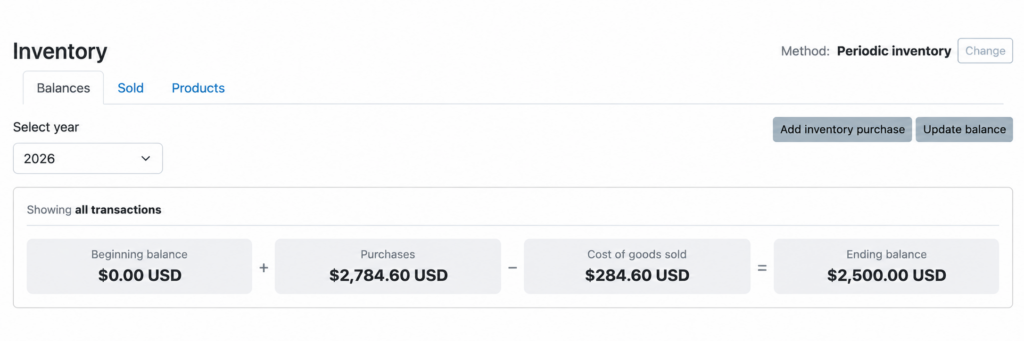
You’ll now see a very similar inventory balances page showing you the totals.
Because you’ve switched to periodic, you are no longer writing off all of your purchases as cost of goods sold, so that amount is no longer showing there. Instead, you need to count up your inventory in order to calculate the cost of goods sold.
One of the great things about periodic inventory is that you don’t HAVE to wait until the end of the year to count up your inventory. You can do it at any time. Let’s say you go and count up your unsold inventory right now, and discover you have $2,500 worth. Here’s where the magic happens. Just click the “Update balance” button in the upper right to bring up the following screen. Type in the amount that you just counted and Seller Ledger does the math for you to determine what your cost of goods sold needs to be.
Click Save and watch your inventory formula update automatically. Your balance has been updated, as has your cost of goods sold so far for the year.
What if I want to track the cost of some individual items?
As it turns out, periodic inventory actually lets you track anywhere from no item level details, all the way up to complete item level detail.
See that “Sold” sub-tab? Click on there to see your recent item sales. Let’s say you know you paid $40 for the most recent sale listed. Click the “Add costs” button next to it.
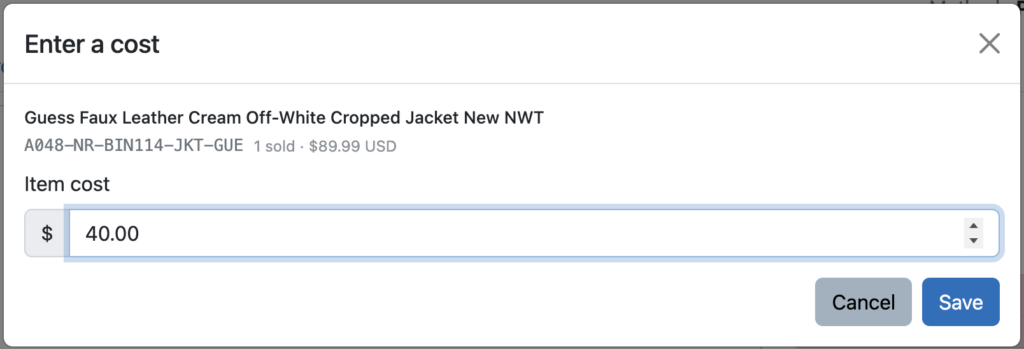
Now enter your $40 cost.
Click Save and we’ll now show you the gross profit on just that item sale.
But here’s the cool part. Click back on the Balances tab. Because the sale you entered the cost for occurred before the balance update you just provided, the cost of goods sold total remains unchanged. However, click on that number and you’ll see something very interesting.
Seller Ledger keeps track of costs that you entered directly, as well as the amount that was calculated based on a balance update. Going forward, you can choose to track the costs of some item sales and we’ll update your cost of goods sold as you go. Then, when you get to the end of the year, you can do a final inventory count, update your balance, and we’ll figure out the cost of items you didn’t bother to record individually.
Wrapping up
If you are ready to take your inventory tracking to something beyond cash-based, but are not quite ready to sign up for perfect detail tracking, this option is for you. It’s even a great option for folks who want to track most of their item details, but just have trouble staying 100% current.
As we do with all new features, we do want to say that there might be some near-term bugs/issues, but email us and we’ll fix them as quickly as we hear about them.
Happy tracking!
Ready to automate your eCommerce bookkeeping?
Join thousands of sellers who save hours every month with Seller Ledger.
With all the recent simplifications and improvements we’ve been making to inventory tracking in Seller Ledger, it’s time to roll out something that many sellers have been asking for: the ability to track cost of goods sold for product bundles and kits.
If you use continuous inventory tracking in Seller Ledger, you likely already have the individual costs of various items you have listed for sale.
But what if you decide to offer several of those items for sale in a bundle, at a discounted price?
If that bundle sells, how do you remove the multiple individual items from inventory and make sure they show up in cost of goods sold?
And then how do you look at profit for that bundled order, or those individual items?
Fortunately, Seller Ledger now helps you with all of this.
Tying a bundle sale back to its underlying products
To link a sold product bundle with its individual items, simply go to Inventory -> Sold, find the sale for the bundled product, and click “Add costs”.
You’ll see a new option in the list, called “Match multiple items”. Click that option to bring up a dialog box where you can select and add each item from inventory that belongs in that bundle.
Click “Save” and Seller Ledger will remove those items from inventory and update your cost of goods sold total.
See your profit per order
Now, when you go back into your marketplace account, click “Expand” on the bundled order. You’ll see how much money you actually make on that order.
A lot of sellers would love to see how much profit they make on each product, but aren’t so excited to track every inventory purchase from acquisition through sale.
To help those customers, we’re pleased to announce a new option that allows any seller to simply type in item costs and see their profit on any sale, after it’s already been made.
How can I enter my item costs?
To be able to take advantage of this feature, you do need to turn on inventory tracking. While you will technically be using the “continuous” inventory approach, you can skip a lot of the steps.
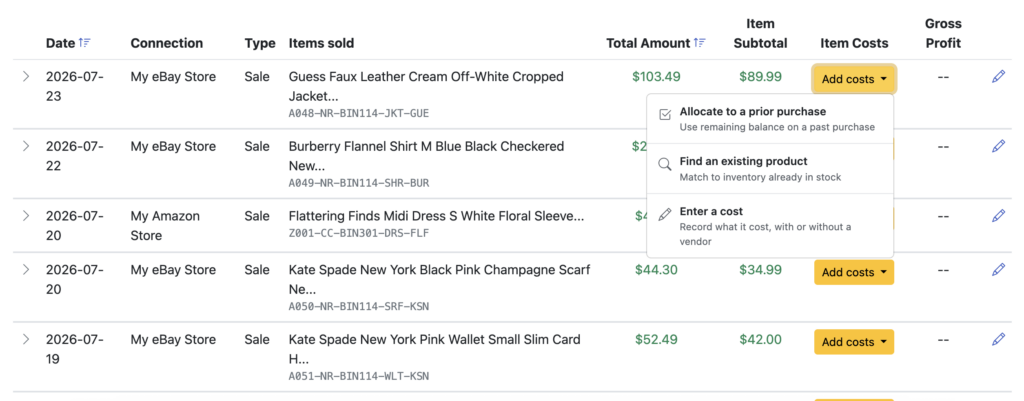
Once you have inventory tracking turned on, simply go to Inventory -> Sold and you’ll see a list of your recent sales, with an “Add costs” button in each row. Click on that button for a sale and choose the bottom option: “Enter a cost”
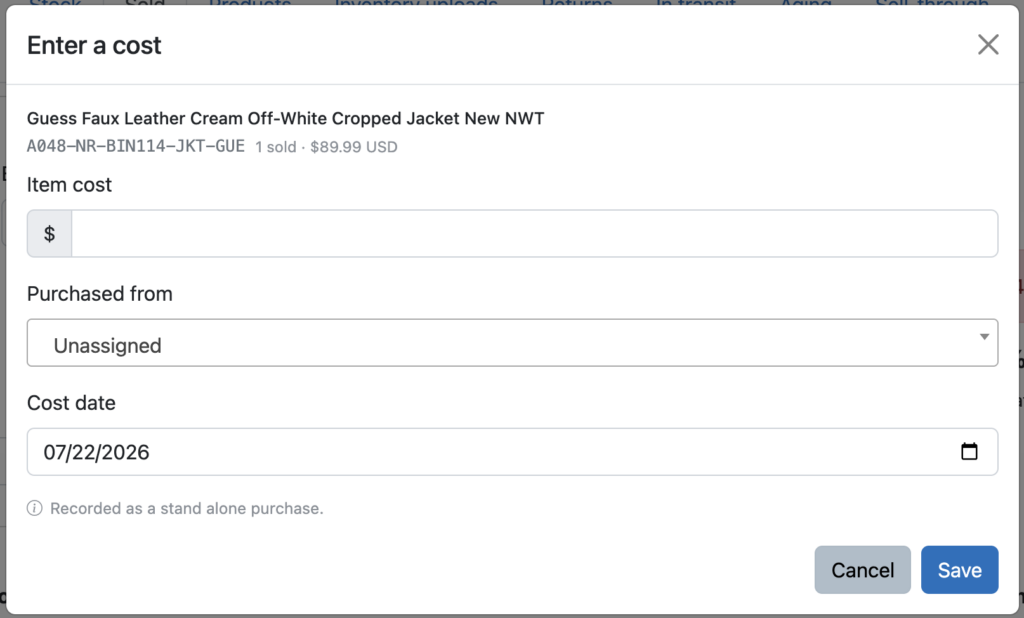
This will bring up a simple form where you can just record the amount you paid for that item, and we’ll handle the rest. You can also assign a specific vendor name and change the purchase date, but it’s your choice. If you want to simply type in the costs of as many items as you can, as quickly as you can – you can now do so.
As soon as you click “Save”, you’ll instantly see your gross profit. And your cost of goods sold will increase by the amount you entered.
Ready to automate your eCommerce bookkeeping?
Join thousands of sellers who save hours every month with Seller Ledger.
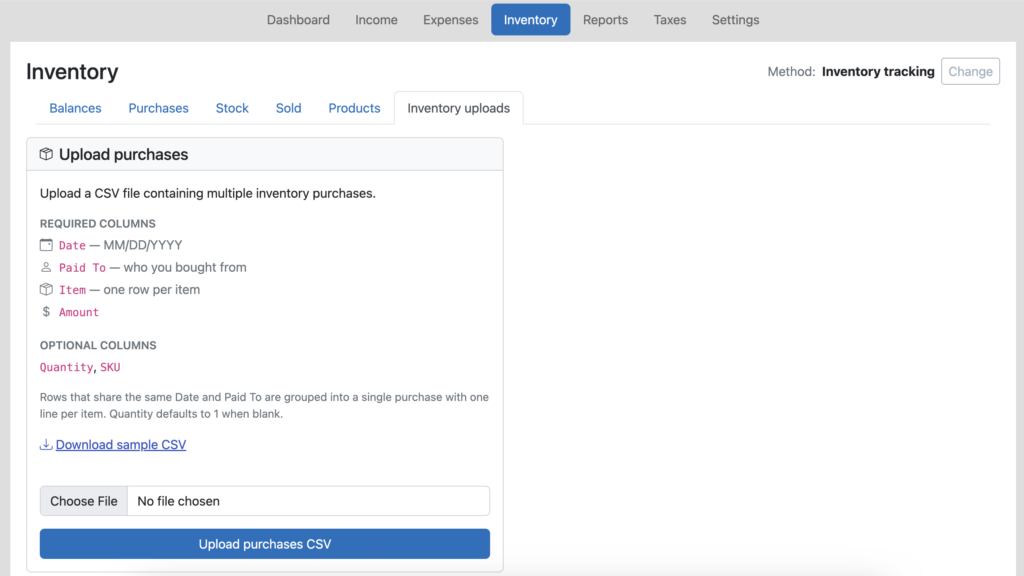
If you have built or bought a spreadsheet template for tracking your product purchases and costs, you can now use that to get a jump start on automating your eCommerce accounting and getting better insights into your net profits. Seller Ledger now lets you upload inventory costs from your spreadsheet.
To start, this feature only works if you have inventory tracking turned on and want to see your profits at the item-level. If you are writing off cost of goods sold as you go, you’ll be more interested in just uploading a list of expenses.
However, if you’ve already been tracking each purchase and sale, you’ve made the investment to see your profitability per item.
Update
Since this article was originally published, we’ve released a much more flexible approach to CSV file formats. You can learn more about that here.
How to upload your existing inventory costs from your spreadsheet
Just go to the Inventory tab in Seller Ledger, and you will see a new “Inventory uploads” sub-tab. Next, open your existing inventory purchase spreadsheet and save it as a new file, in a CSV format. And make sure to rename any of the columns to match our layout.
Pro tip
If you don’t already have unique SKUs for each item in your spreadsheet, we strongly recommend adding them. They are the secret to automating the matching of sales to cost, reducing inventory and calculating cost of goods sold.
That’s it. You’ve just jump-started your switch to a more automated method for tracking your profits on each sale/item.
Ready to automate your eCommerce bookkeeping?
Join thousands of sellers who save hours every month with Seller Ledger.
Perhaps the most important financial metric for any eCommerce business, and one of the hardest to calculate at scale, is the net profit you make on every item sold.
Well, Seller Ledger has just rolled out the “holy grail” of eCommerce reports – the ability to see your profit on each item sale.
Do you know which products are actually making you money?
Net profit per item sale is what you’re left with after subtracting all directly-linked expenses from the income you produce by selling an item. It’s the ultimate bottom line.
But figuring out this number is incredibly difficult, particularly if you sell on more than one channel. You need to account for so many potential numbers, which vary widely by channel:
Sales price
Any discounts offered
Shipping charges you may collect from the buyer
Sales commissions paid to the listing platform
Potential payment processing fees
Advertising/promotion/boosting fees
Potential inventory storage fees
and many more
And while each platform provides these numbers, they are not always presented together in a single view.
Then, there’s what is often the single biggest determination of your profit – cost of goods sold. Most platforms don’t know this, and a lot of sellers prefer not to share it (for good reason – given concerns about platforms using that data against them.)
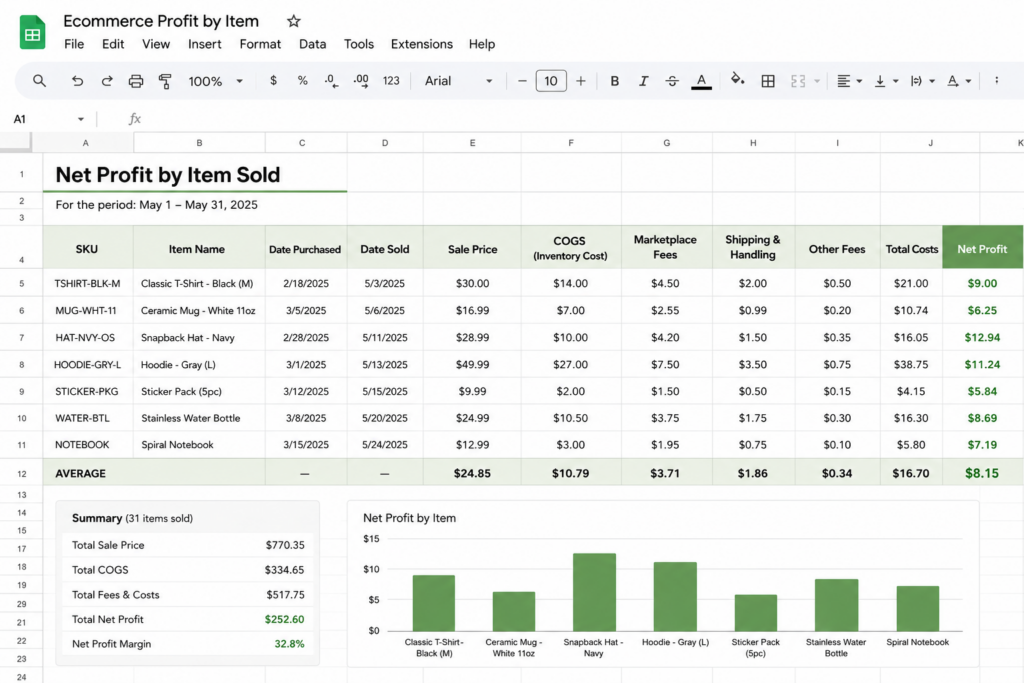
The classic solution—spreadsheets!
Sellers have been using spreadsheets to try to figure this out for decades. In fact, there are lots of experienced sellers and influencers across the web offering spreadsheet templates to help sellers track these numbers.
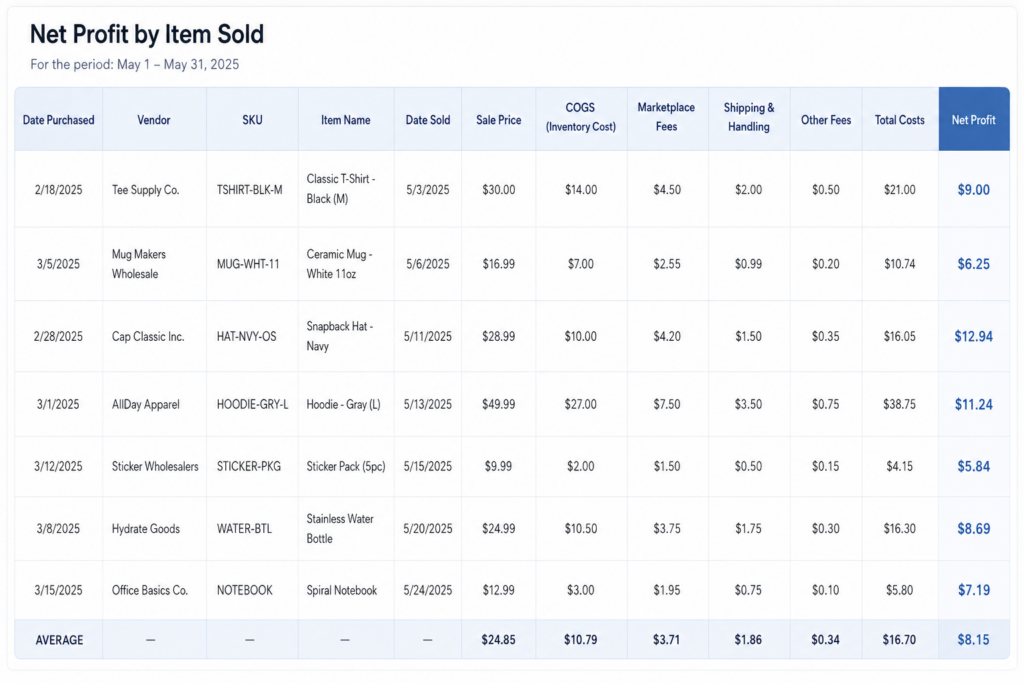
Does this look familiar?
While very good at calculating the numbers you want to see, there is one massive limitation in these spreadsheets: the amount of time to keep them up to date. If only these spreadsheets could update themselves.
Actual profit, for every product, by channel—all in one place
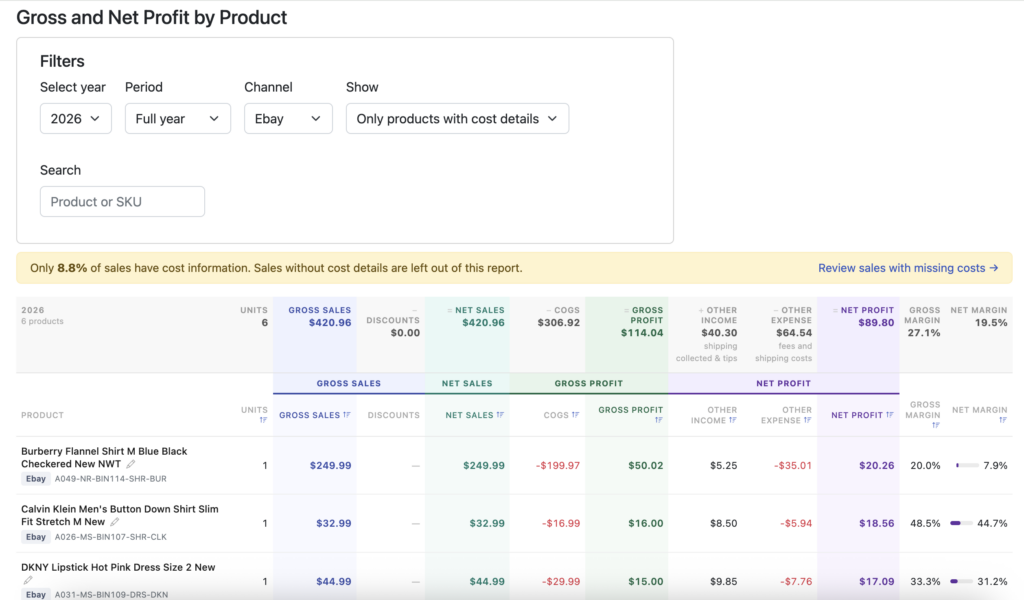
If you go to the Reports tab, you will see a new sub-tab called “Gross and Net Profit”. This replaces and expands the prior “Gross Profit” report. Click into it to see your full profit picture by product.
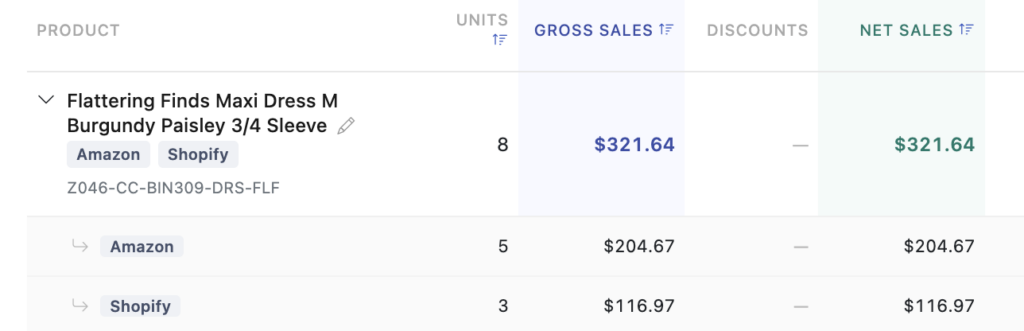
You can view by individual channel or by all of them. If you have sold the same product in multiple channels, you’ll be able to expand that row and see and compare the profit numbers between those channels.
In addition, for those sellers with a LOT of inventory, you can search both by product name and SKU.
What you can do with this information
Knowing how much you make on each item, on each channel, gives you the power to make smarter decisions in your business:
Source better products: You are now armed with the most accurate information on which items generate the most profit. Find more of them.
Spend your ad dollars better: Make sure your advertising/promotional spend is paying off for you
Change your pricing on each channel: You can now factor in all costs from a channel to see if pricing needs to be adjusted.
Allocate inventory differently: Prioritize the channel/product combinations that make you the most profit.
Stop losing money: Identify any products on any specific channels and stop selling them.
How to get the most from this report
In order to get set up to have this information at your fingertips, there a few things that will help tremendously when using Seller Ledger.
Connect your sales channels: first, you need to connect your sales channel/platform to Seller Ledger. You can find our most current list here, and know that it is likely to continue growing.
Turn on inventory tracking: If you are just writing off “cost of goods sold” as you buy inventory, this level of insight won’t be available to you. But if you’d like to get this report, go to the Inventory tab and change your method to “Inventory Tracking.” We’ve also made it very easy to switch back if you prefer not to continue.
Load your item costs into Seller Ledger: Make sure you include unique SKUs for each item. As a reminder, you can add them individually, upload a receipt or even a CSV file.
Include SKU when listing your item: most platforms make this pretty obvious when listing, while others may require an extra step.
Not all platforms support automatic SKU matching
The following connected platforms don’t provide support for SKU fields: Mercari, Depop, Manapool
However, we do provide the ability to match sold items to inventory after-the-fact, so you can still get the insights you need.
Ready to automate your eCommerce bookkeeping?
Join thousands of sellers who save hours every month with Seller Ledger.
To better help you manage the products you sell, Seller Ledger has added a new view under the Inventory tab. In addition, for those of you who are not tracking inventory (i.e. using a “cash-based” approach) and writing off cost of goods sold directly, you’ll notice that the Inventory tab now has more useful features.
Finding your products
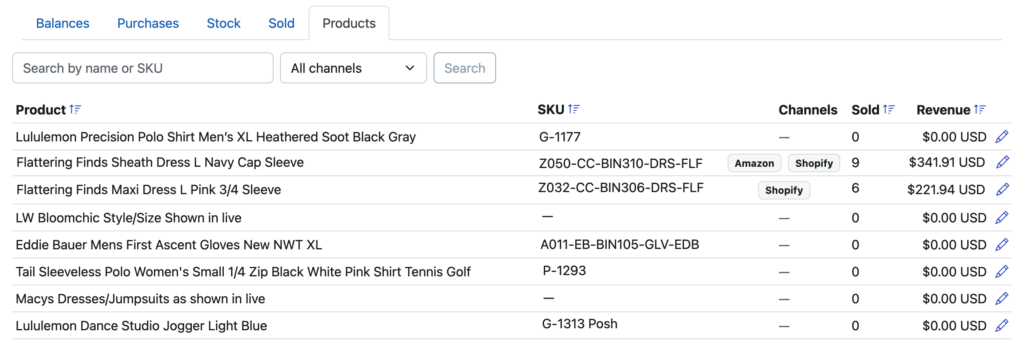
Clicking into the Inventory tab, you will see a new sub-tab called “Products”. For those of you already tracking inventory, it will show to the right of the other tabs.
For those of you writing off cost of goods directly, you’ll also have access to the new Products tab, just without the extra Inventory tabs:
Editing your products
Click into your products tab to a see a list of every product that you have either sold or loaded purchase/cost information for. We show you each product’s name, SKU, how much has been sold and on what channels.
You can sort by product name, by SKU, number sold or revenue.
If you have multiple copies of the same product that use slightly different names, now you can correct that. The same holds for cases where you are missing SKUs or using the same SKU for different items. Correcting those makes it possible to fully automate your cost of goods sold and see your profit per order.
Ready to automate your eCommerce bookkeeping?
Join thousands of sellers who save hours every month with Seller Ledger.
As we have done with both eBay and Amazon, we also recently released the ability for Walmart customers to view the NET profit on each order.
Walmart profit per order
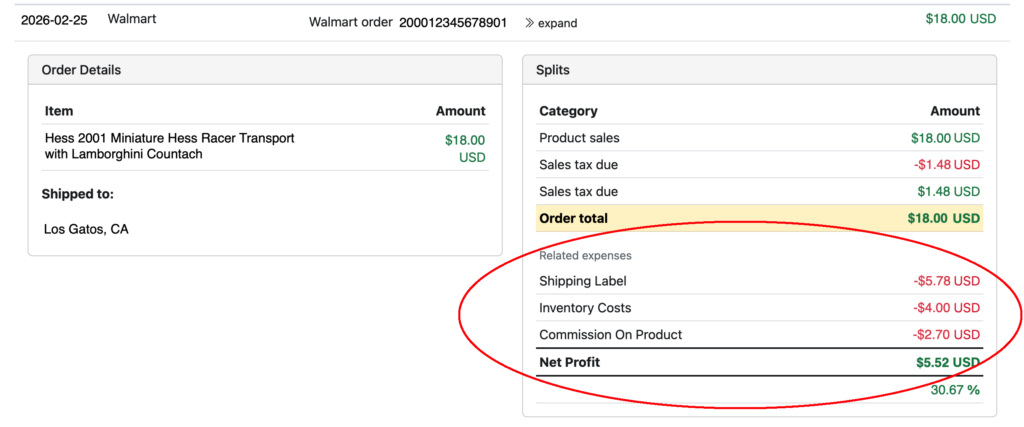
Click the “>>expand” link next to any order in your Walmart account. Under the category split totals that make up that order, you will see a new “related expenses” section that includes other fees and expenses that are tied to that order. This includes the Walmart commission charged for that order. In addition, if you purchase shipping labels through Walmart, we include that too.
Lastly, as mentioned when rolling out our Gross Profit report, if you track your inventory costs at the item level and use unique SKUs for each of your Walmart items, we will match those costs to the correct item. That, plus the other related expenses, helps you see the true NET profit for each order on Walmart.
If you are a Walmart seller who’d like this kind of visibility and automation in your accounting, give Seller Ledger a try. We offer a 30-day free trial, no credit card required.
Ready to automate your eCommerce bookkeeping?
Join thousands of sellers who save hours every month with Seller Ledger.